Alternative MITRE ATT&CK Navigator: My MITRE ATT&CK Visualizer 2.0
- Tech Man
- Aug 16, 2025
- 3 min read
Updated: Aug 17, 2025

MITRE ATT&CK Visualizer 2.0
In cybersecurity, understanding adversary tactics and techniques is crucial for building effective defenses. The MITRE ATT&CK Enterprise Matrix is an invaluable framework that maps out how tactics and techniques used by adversaries to conduct cyberattacks. While the official MITRE ATT&CK Navigator is a powerful visualization tool, using it can be a manual and time-consuming process.
To streamline this, I recently upgraded a custom Python script (See my github for the code) to achieve up to 99% automation. The new version significantly improves on the old one (see here), which could only visualize main techniques for a maximum of two adversaries. My updated program now includes sub-techniques, allows for annotating more than two adversaries, and shades the matrix to represent the frequency of their usage.

Image 1. Snapshot of annotated MITRE ATT&CK Enterprise Matrix Based on the frequency of techniques and sub-techniques, the program retrieves the top N (default: 5) recommended mitigation and detection measures from the MITRE ATT&CK website. The value of N can be customized in get_technique_information.py to suit the user's specific use case. The results are exported to an Excel file named defence_measure.xlsx."

Upgrading the Program: Sub-techniques and Frequency
The new program focused on two key improvements:
Incorporating Sub-techniques: Many techniques in the ATT&CK framework have sub-techniques that provide more granular detail. My upgraded program now includes these sub-techniques, offering a more precise and accurate representation of adversary behavior.
Frequency-Based Shading: This is the most significant enhancement. Instead of a simple highlight, the program now uses a color gradient to visualize the frequency of a technique's use across all the selected threat actors. A darker shade indicates a more frequently used technique, while a lighter shade suggests it's used less often.

How it Works ⚙️
The program is built using Python, and it leverages the MITRE ATT&CK Enterprise Matrix (MAEM). The process can be broken down into these steps:
MAEM to excel: Go to MITRE site and select "layout flat" and "show sub-techniques" for the MITRE ATT&CK Enterprise Matrix.
Manual Copy: Manually copy the MITRE ATT&CK Enterprise Matrix into excel.

Image 5. Copy the MITRE ATT&CK Enterprise Matrix into excel Format Excel: The program will format the excel accordingly.
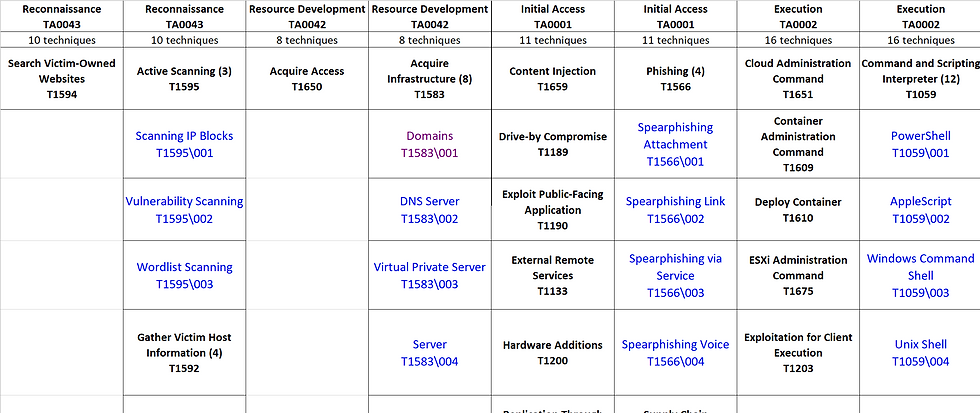
Image 6. Formatted excel of the MITRE ATT&CK Enterprise Matrix Retrieve Threat Actor Group(s) and associate TTs: The program includes a function that retrieves threat actor group(s), as tracked by MITRE, from a default text file (threat_actor_group.txt). Another function will then pull the associated tactics, techniques, and sub-techniques (TTs) for each group and annotates them in a formatted Excel file. User can modify the functions to pull TTs from their subscribed threat intelligence.

Image 7. threat_actor_group.txt Frequency Counting: For each technique and sub-technique, the program tallies how many of the specified threat actors use it. This creates a simple but powerful frequency count.
Image 8. Example of frequency count Shade Matrix: Finally, the program will use the frequency count to apply a color gradient to each cell in the matrix. The more frequent the technique, the darker its shade in the visualization.

Image 9. Shaded excel matrix Defense Measures: Based on the frequency of techniques and sub-techniques, the program retrieves the top N (default: 5) recommended mitigation and detection measures from the MITRE ATT&CK website. The value of N can be customized in get_technique_information.py to suit the user's specific use case. The results are exported to an Excel file named defence_measure.xlsx."
Image 10. Defense Measures

Conclusion
This visual representation offers a clear and intuitive way to understand shared adversary behaviors. Instead of cross-referencing multiple threat actor profiles, users can view a single, consolidated matrix of their collective tactics, techniques, and sub-techniques (TTs). It allows user to:
Prioritize Defenses: By identifying the most frequently used techniques, user can prioritize resources on building and improving detections and mitigations for commonly used TTs.
Enhance Threat Hunting: The visualization can serve as a starting point for threat hunts. By focusing on the darker-shaded techniques, user can search for indicators of the common TTs.
Improve Adversary Emulation: The frequency data can help user to create more realistic and targeted red team or adversary emulation exercises that mimic the most common TTs of a group of relevant threat actors.

I read the post about the alternative MITRE ATT&CK Navigator and it showed how visual tools make complex cyber threats easier to understand and analyze. Last semester when I was struggling with confusing lessons I used easy associate level course help because I needed extra support to finish assignments on time and understand tricky concepts. That taught me that steady guidance and consistent effort make difficult topics much more manageable.